Financieel Inzicht
Providing users with real-time financial control over their future
Client
TJIP
Period
July - December 2025
Tools
Figma
Project type
Inhouse Product Development
Project Description
This platform turns complex pension data into an interactive, milestone-driven experience. By allowing users to model "what-if" scenarios (like early retirement or major life events) the tool delivers instant financial feedback, replacing traditional jargon with actionable personal clarity.

Introduction
Pension planning is traditionally viewed as distant, complex, and detached from daily life. Dense jargon and abstract numbers often prevent people from actively engaging with their financial future. The core objective of this project was to bridge that gap: transforming passive data into a deeply personal, interactive financial navigation tool.
Rather than overwhelming users with static projections and technical terminology, the platform anchors pension strategy around human milestones. Users can define and visualize what matters most to them. Whether that means achieving early retirement, securing a specific lifestyle, buying a dream home, or funding major family life events.
How It Works:
-
Dynamic Scenario Engine: Users can seamlessly explore interactive "what-if" scenarios, instantly testing how different financial inputs and lifestyle choices affect their long-term position.
-
Real-Time Integration: By connecting actual, live pension data directly to a dynamic calculation engine, the interface delivers immediate financial feedback as users adjust their goals.
-
Human-Centered Clarity: Complex financial mechanics are translated into clear, visual progress indicators, making abstract future planning feel tangible, immediate, and actionable today.
Briefing
The objective for the upcoming Financieel Inzicht project, in collaboration with TJIP’s Pension Department, is to design a digital tool that translates complex data from sources like mijnpensioenoverzicht.nl into an accessible, real-time overview of a user’s retirement goals. The platform should aim to process intricate financial calculations to highlight funding gaps, surface actionable next steps, and deliver a fully WCAG-compliant user experience.

My responsibilities
Set up requirements
Understanding the technology, goals, and needs, and translating them into product requirements while integrating them effectively.
Design Systems
Creating customized components with fonts, colors, button states, and other UI elements for the 'Delftsche' DS.
Multidisciplinary collaboration
The final product has been achieved through close collaboration and the combined expertise of various specialists.
Deliverables
Develop wireframes, high-fidelity designs, and prototypes for stakeholder presentations.
Accessibility (WCAG)
We prioritized WCAG standards for accessibility in our product development, ensuring an inclusive design for all users.
Handover to development
A seamless transition is crucial. Effective communication and direct connections foster alignment.
Prototype video
To validate the core interaction model and user engagement, the current functional prototype specifically focuses on a key user journey: Starting with the onboarding of Joost van Veen to capture essential personal and household metrics. After completing the onboarding, the first calculations on the Overview screen are done. It seems that Joost doesn't have enough pension saved to live comfortably during retirement. The tool suggests an annuity (lijfrente) to overcome this. After adding the annuity, it appears that Joost has more than enough live comfortably. Therefore, the tool advises Joost on other scenarios that are currently adequate, such as early retirement. With real-time calculations and a visual chart, it shows a clear prediction of all the possibilities. In addition, the profile page allows users to add, edit, or remove home and vehicle details to ensure the underlying NIBUD expenditure engine uses, real-world data.
Key functionalities
Create your financial profile
-
Low-Friction Input: Designed an approachable onboarding flow to capture essential personal and household metrics without user fatigue.
-
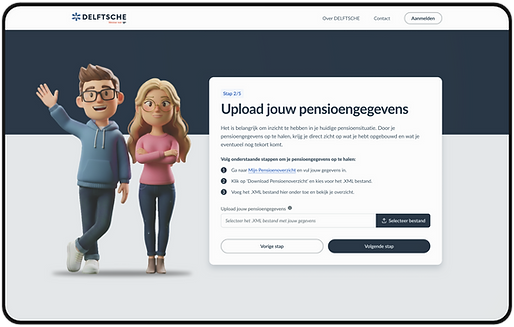
Data Integrations: Combined direct pension data imports (mijnpensioenoverzicht.nl) with user-submitted details (gross income, partner, children).
-
Automated Benchmarking: Leveraged NIBUD reference data tied to housing type and car ownership to estimate realistic household expenditure automatically.
-
Outcome: Instantly generates a clear, initial baseline impression of the user's retirement outlook.

Comprehensive retirement overview
-
At-a-Glance Financial Snapshot: Designed a modular dashboard presenting key metrics, including expected net monthly income, retirement age, payout type, and pension in clear, digestible cards.
-
Proactive Goal Management ("Mijn Wensen"): Highlighted potential funding gaps directly alongside contextual, actionable solutions, such as adding a private annuity (lijfrente), extending working years, or adjusting short-term payout structures.
-
Transparent Data Breakdown: Provided structured access to underlying foundational layers, like AOW and long-term financial timelines, for deeper exploration.
Pension development, visualized
-
Interactive Modeling & Real-Time Feedback: Built a dynamic, standardized flow for configuring private annuities (lijfrente) and other pension scenarios, allowing users to adjust inputs as lump-sum deposits or recurring contributions while an instantly updating graph visually maps all new income streams against projected expenditures in real time.
-
Clear Value Proposition: Displayed immediate benefit summaries (e.g., net extra monthly income at retirement age) directly above the chart to make financial outcomes tangible.
-
Layered Data Representation: Used distinct color coding to differentiate foundational financial components, such as baseline income, AOW, existing pensions, and potential annuity additions, giving users full transparency into their future financial stack.


A complete profile offers clearer opportunities
-
Structured Data Input & Progress Tracking: Designed a sidebar-driven navigation hub featuring visual status indicators (checkmarks and alert icons) to guide users through refining personal metrics, such as income and expenses, while ensuring profile completeness for accurate calculations.
-
Detailed Asset Breakdown: Formatted complex household data into clean cards and tabbed views (e.g., housing and vehicles), making it easy to review asset values, mortgage details, and property specifications.
-
Granular Customization: Allowed users to add, edit, or remove home and vehicle details to ensure the underlying NIBUD expenditure engine uses precise, real-world data.